GEMSS Cardio Project Details Consortium Reports & Presentations Software Collaboration

Comparison of Model with Femoral Artery Stenosis and Standard Model

Cardiac flow input to model

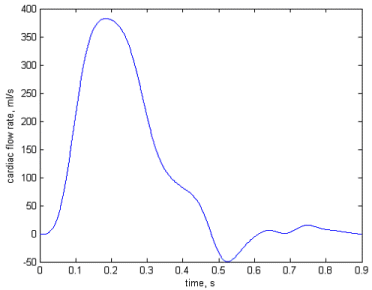
The cardiac flow profile shown opposite was applied to the model. The simulation was run for five cardiac cycles to allow the system to settle down, and the results for the last cardiac cycle are shown. The results given below compare a model in which a stenosis has been created in the left femoral artery with the standard Westerhof model. The stenosed artery radius was decreased from 2.38mm to 1mm, resulting in a reduction in the lumen area by 82%.

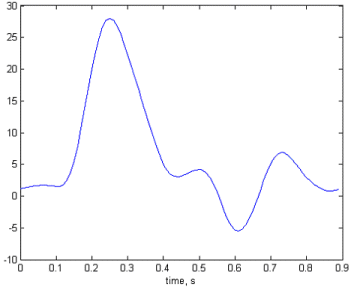
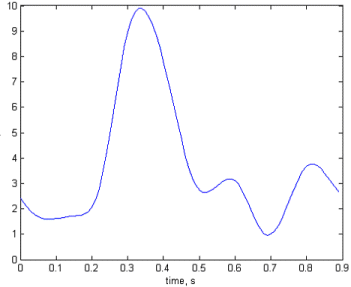
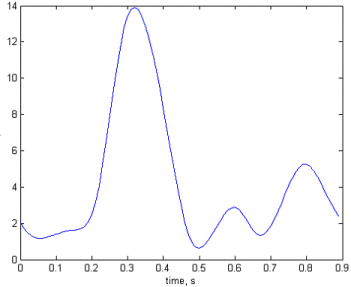
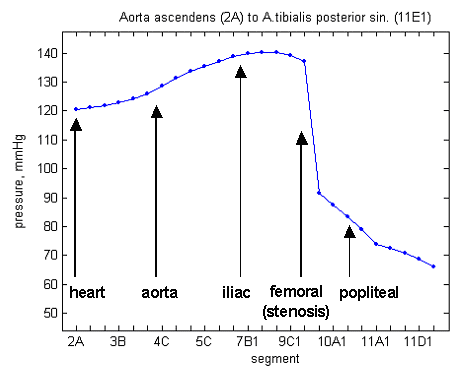
The analysis below shows that the flow in the left iliac artery, upstream of the stenosis, is reduced. The flow in the left femoral artery, downstream of the stenosis, is also reduced, and by a greater proportion. The flows in the right femoral and iliac arteries are affected little by the introduction of the stenosis. The final figure shows the pressure drop across the stenosis at time 0.3s.

Cardiac flow input to model

Maximum Flow Rates

MAXIMUM ARTERIAL FLOWModel with Left Femoral Artery StenosisStandard Model
Left Iliac (above stenosis) 28.0ml/s (46%) 33.0ml/s
Right Iliac 33.5ml/s (54%)
Left Femoral (below stenosis) 9.9ml/s (42%) 13.9ml/s
Right Femoral 13.7ml/s (58%)

Variation in Flow Rate over the Cardiac Cycle

ARTERIAL FLOW, ml/sModel with Left Femoral Artery StenosisStandard Model
Left Iliac
(above stenosis)
Left iliac Flow (stenosis model) Iliac Flow (standard model)
Right Iliac Right iliac Flow (stenosis model)
Left Femoral
(below stenosis)
Left femoral Flow (stenosis model) Femoral Flow (standard model)
Right Femoral Right femoral Flow (stenosis model)

Arterial Pressure Profile across the Stenosis at time 0.3s

Pressure Profile across the Stenosis

[an error occurred while processing this directive]